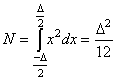
Rechnernetze
![]()
![]()
|
Rechnernetze |
|
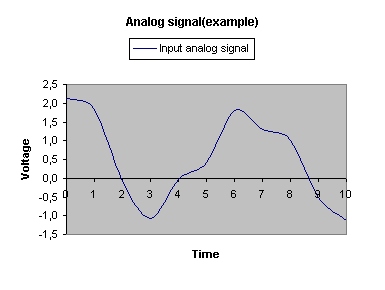
PCM - Pulse Code Modulation Diese Site wurde kopiert von http://www.rasip.fer.hr/research/compress/algorithms/fund/pcm/index.html Was ist PCM? PCM ist ein Methode, analoge in digitale Signale umzuwandeln.
What is PCM?PCM is a method of converting an analog into digital signals. Information in an analog form cannot be processed by digital computers so it's necessary to convert them into digital form. PCM is a term which was formed during the development of digital audio transmission standards. Digital data can be transported robustly over long distances unlike the analog data and can be interleaved with other digital data so various combinations of transmission channels can be used. In the text which follows this term will apply to encoding technique which means digitalization of analog information in general. PCM doesn`t mean any specific kind of compression, it only implies PAM (pulse amplitude modulation) - quantization by amplitude and quantization by time which means digitalization of the analog signal. The range of values which the signal can achieve (quantization range) is divided into segments, each segment has a segment representative of the quantization level which lies in the middle of the segment. To every quantization segment (and quantization level) one and unique code word (stream of bits) is assigned. The value that a signal has in certain time is called a sample. The process of taking samples is called quantization by time. After quantization by time, it is necessary to conduct quantization by amplitude. Quantization by amplitude means that according to the amplitude of sample one quantization segment is chosen (every quantization segment contains an interval of amplitudes) and then record segments code word. To conclude, PCM encoded signal is nothing more than stream of bits. The first example of PCM encodingIn this example the signal is quantized in 11 time points using 8 quantization segments. All the values that fall into a specific segment are approximated with the corresponding quantization level which lies in the middle of a segment. The levels are encoded using this table:
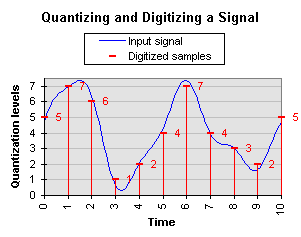
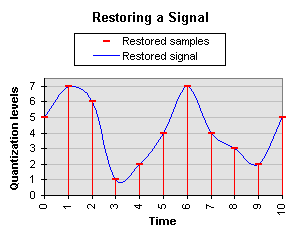
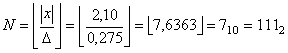
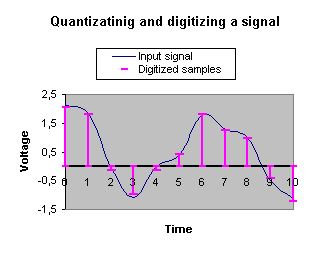
Table1. Quantization levels with belonging code words The first chart shows the process of signal quantizing and digitizing. The samples shown are already quantized - they are approximated with the nearest quantization level. To the right of each sample is the number of its quantization level. This number is converted into a 3-bit code word using the above table. Chart 1. Quantization and digitalization of a signal The second chart shows the process of signal restoration.The restored signal is formed according to taken samples. It can be noticed that the restored signal diverges from the input signal. This divergence is a consequence of quantization noise. It always has the same intensity, independent from the signal intensity. If the signal intensity drops, the quantization noise will be more noticeable (the signal-to-noise ratio will drop).
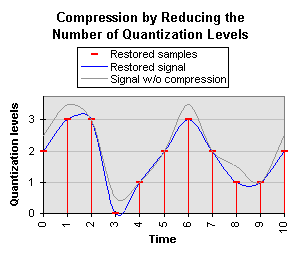
Chart 2. Process of restoring a signal. PCM encoded signal in binary form: Basic compression methods1.Reducing number of quantization levelsThe number of quantization segments can be reduced by joining two neighboring segments into one. This means that finally we will have 4 quantization segments unlike the previous case in which we had 8 segments. Four quantization segments can be coded using 2-bit code words, this will be shown in the table below.
Table 2. Quantization levels with belonging code words (after compression) The chart shows the reconstructed signal after compression. It still has the same basic contours, but the distortions are greater due to coarser approximation - the quantization noise has increased. This is due to the fact that the quantization step is now double in size than with the uncompressed PCM.
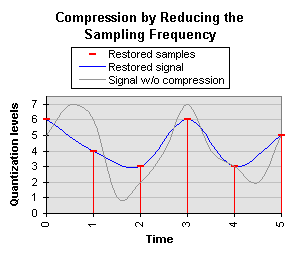
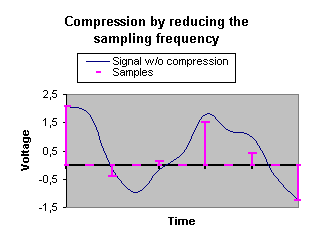
Chart 3. Compressed and restored signal with a restored sample The compressed signal is PCM encoded as follows: Practical use of this method 2. Reducing the number of samplesAnother basic method of compression is to reduce the number of samples. The number of samples can be reduced in the way that each two segments are replaced with one sample which is equal to their average. After the number of sample has been reduced in that way we halved number of samples which means that the sampling frequency has been halved. And because the bandwidth of the restored signal is directly proportional to the sampling frequency (B=0.5Fs), the net result is that it got halved as well. In our example this resulted in the loss of the highest frequency component of the signal:
Chart 4. Compressed and restored signal with restored samples In practice we have to decide which frequencies are relevant to our application and which can be left out to achieve a reasonable size of the recording. The second exampleThe second example - a more quantitative approach to the PCM, meaning that in
following text an approximate approach to the calculating will be shown. Now let's take values of analog signal in discrete time intervals.
Table 1. Analog signal values taken in discrete time intervals The first step was to take values of signal in discrete time intervals, now
it is time for amplitude quantization. Fig1. Um-maximum input voltage
D - quantization step
Table 2. Input voltage intervals with belonging segments Segments are numbered in the way that segment 0 represents the lowest input
voltage range. FORMAT OF CODE WORD:
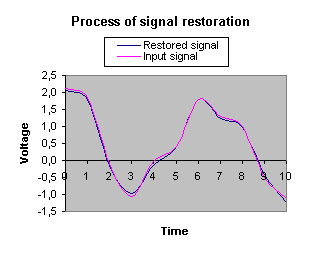
Now, lets see example of coding two analog values: D=0,275 [V] - value calculated in Fig 1. x - analog value Code word: x is positive
voltage so MSB is 1, three bits are binary coded result of amplitude
quantization (N=111). Ex2. x=-1,64 [V] D=0,275 [V] - value calculated in Fig 1.
x - analog value Code word: x is negative
voltage so MSB is now 0, three bits are binary coded result of amplitude
quantization (N=101). As was presented the quantization level is the value which lies in the middle of the segment. So every quantization level in this example has a belonging voltage representative.In the following table quantization levels with belonging voltage representatives and code words will be shown. So after a code word is calculated it is possible to find in which quantization level the observed voltage lies.
Table 3. Quantization levels with belonging voltage representatives and code words It can be noticed that unlike first example the code word in general is not a binary represented quantization level, positive values of quantization levels are just binary representatives, while negative values are represented binary in different way which corresponds to the encoding process. After we established the quantization levels and belonging voltage representatives it can be shown how the example analog input is quantized.
Table 4. PCM encoded input signal value After quantization levels are formed we can see how the input signal is quantized and digitized.
Chart 2. The input signal with digitized samples Finally, PCM encoded input signal in binary form looks like this: If we want to restore the original signal we will have to follow the digital
PCM recording and using quantization levels representatives form an analog
output.
Chart 3. Input signal and restored signal As it can be seen in Chart 3. that there is a slight divergence of restored
signal from the input signal.
Fig 2.
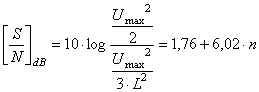
More important than quantization noise is signal to noise ratio. Fig 3.We should know the power of the signal which we don't so just to show
approximately how to calculate let's suppose that input signal is sinusoidal,
then we could calculate the signal to noise ratio.
n - number of bits
Basic compression methods1. Reducing numbers of quantization levelsThe signal can be compressed if we reduce the number of quantization segments.
We can reduce the number of segments from 16 to 8, so we will end up with 3 bit
code words instead of 4.
Table 4. Input voltage range with the reduced number of segments
Now, we can use a Table 3. to form a Table 5.
Table 5. Quantization level, representative,code word for reduced number of segments(levels) Now, of course we must form PCM encoded table for our example by joining quantization levels in Table 4.
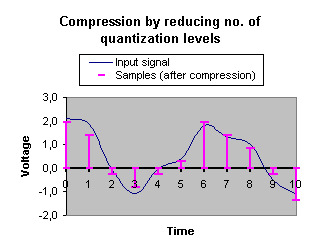
Table 6. PCM encoded signal values after compression It can be now shown how we form compressed signal joining neighborhood levels, as described earlier in the text. The following chart will show how the signal is compressed with halved quantization levels.
Chart 4. Compression by reducing number of quantization levels PCM encoded compressed signal in binary form looks like this:
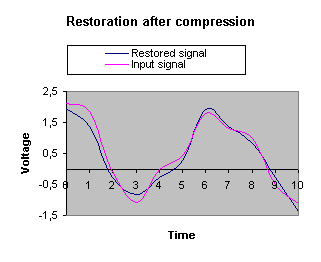
Chart 5. Process of restoration (when compression is used) As it can be noticed divergence from original signal is now greater because
the step of quantization was doubled. The result of the compression is the
increased quantization noise.
The result confirmed earlier showed the fact that quantization noise will be
increased.
We can notice that the signal to noise ratio dropped because noise has been increased by a process of compression. 2. Reducing the number of samplesReducing the number of samples is a second method of signal
compression. This compression can be formed when two neighboring samples are
replaced with one which is equal to their average.
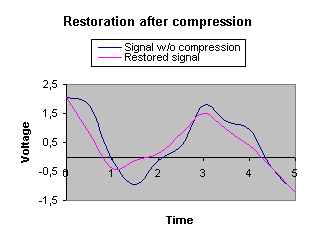
Table 7. PCM encoded signal values after compression In the following chart it will be shown how a signal with compression is formed which includes reducing sampling frequency.
Chart 7. The restored signal and the signal before compression by reducing sampling frequency PCM encoded signal with compression by reducing sampling frequency in binary
form: The final wordToday and in the future, research will be concentrated on developing new PCM signal compression methods. These compression methods should have higher compression rates, probably over 100:1 with unnoticeable loss in signal quality. The basic signal quality is measured by human perception, so various segments of human perception are being studied in detail. According to these studies compression methods are formed, the signal restored after compression has only components of the original signal which are above the threshold of perception. In the 80's compression methods was based on classical information theory. The basic technique was to find redundancy in data (images, etc.) and according to that to conduct the compression. Compression of images is segment of data compression which was probably mostly exploited. So image-compression based on the techniques described above can be called first generation image coding techniques. The second generation image coding techniques takes in consideration various aspects of human visual system in order to achieve greater compression rates without significant loss of image quality. That means that those coding techniques are lossy, but an important characteristic of this technique is in that it identifies and separate visually relevant and irrelevant parts of an image and then uses appropriate coding techniques for these parts.
|